Monitoring Spring Boot Applications
PROJECT SETUP
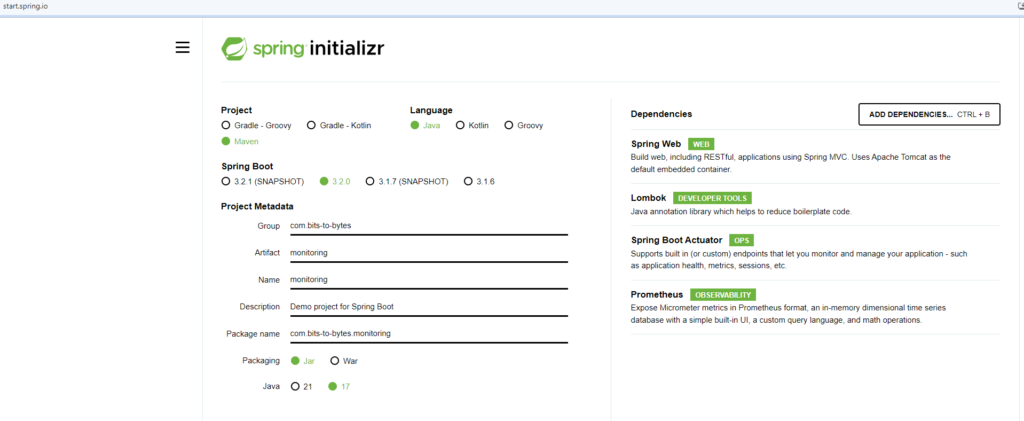
Create a new Spring boot project using link: start.spring.io and following dependencies:
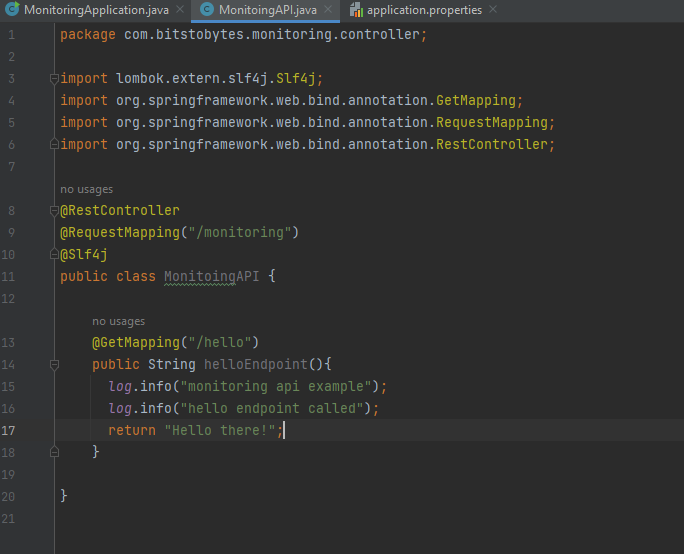
Expose an endpoint and log some statements:
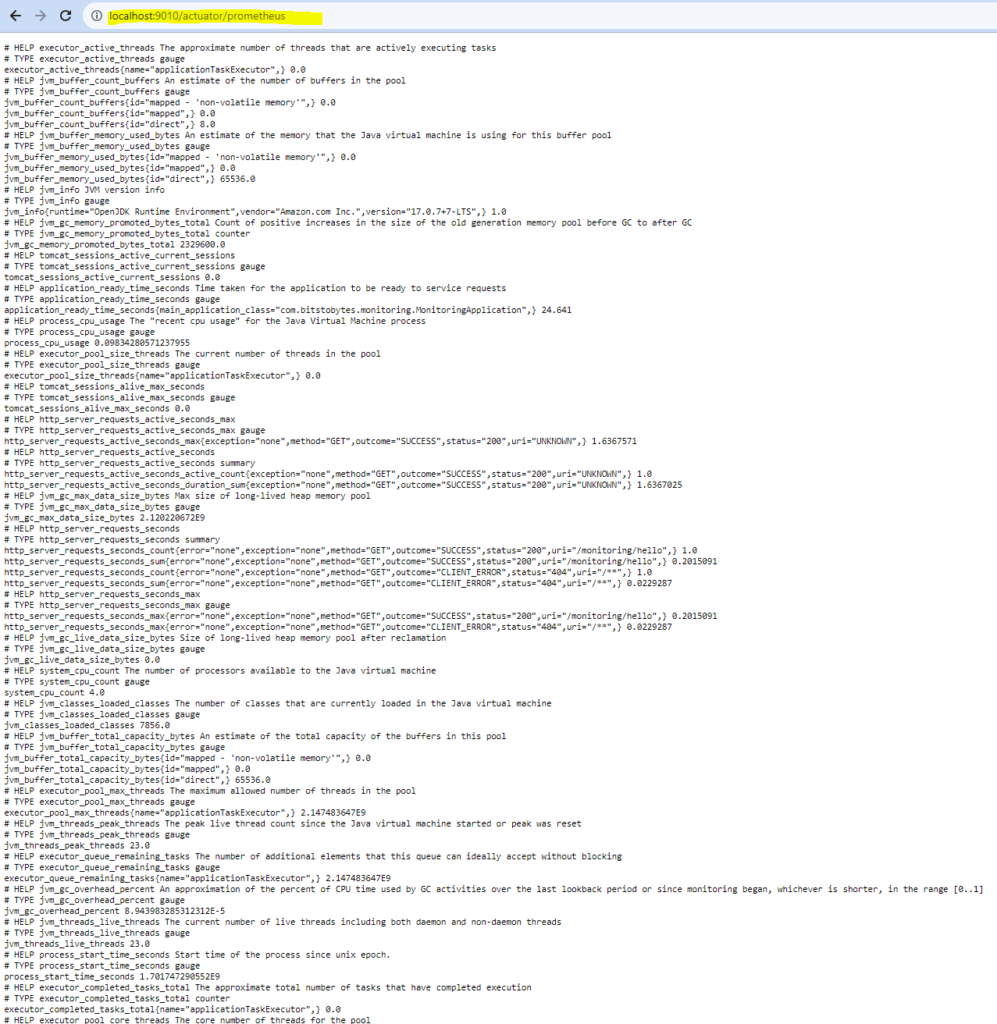
Make Prometheus endpoint accessible:

Run and access hello endpoint:

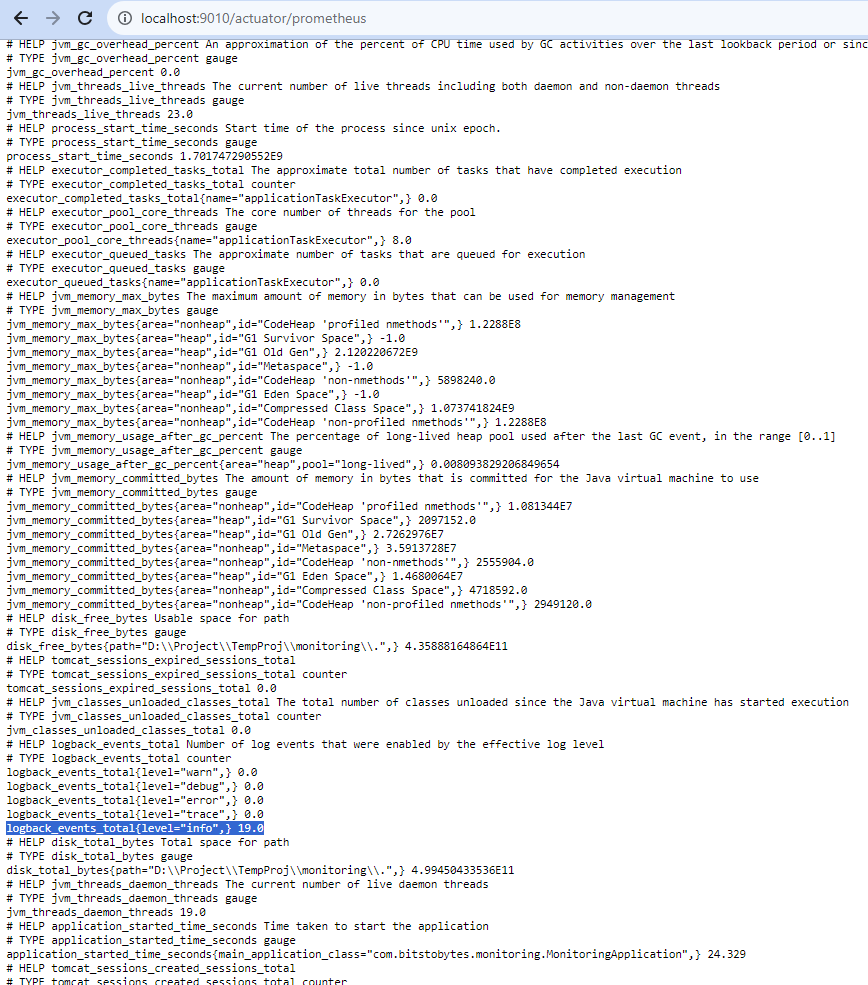
Access prometheus endpoint:
PROMETHEUS UI INTEGRATION WITH OUR APPLICATION
Download latest version of Prometheus from: prometheus.io
Open Prometheus.yaml file which would be present in the same folder as Prometheus executable:
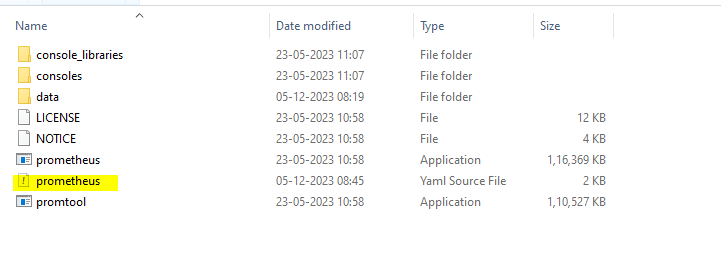
Add your project config job under scrape_config parameter:
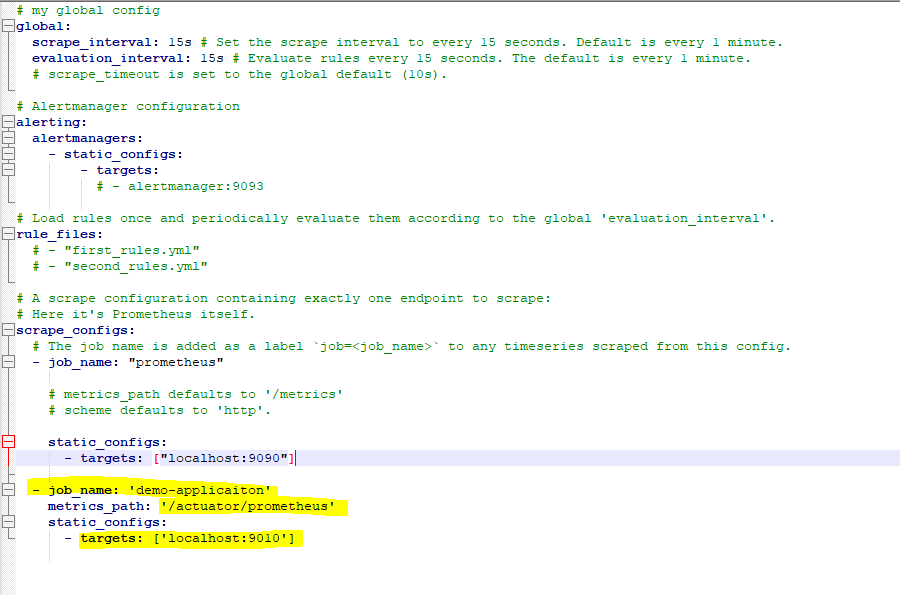
Save and run prometheus executable and access from browser. (Default port for prometheus os 9090. You can change it from the same yaml file, key= ‘static_configs: targets’):
Go to status- Targets:
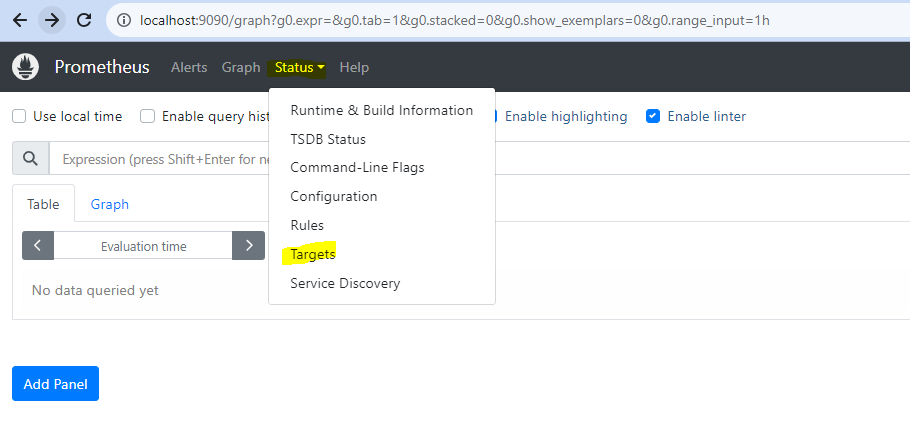
Our application should be visible here:

In search query we can query any of the parameter that are available in actuator/prometheus endpoint:

GRAFANA INTEGRATION WITH OUR APPLICATION
Download and install the latest version of grafana from: grafana.com
After installing, grafana should be accessible from your browser at localhost:3000
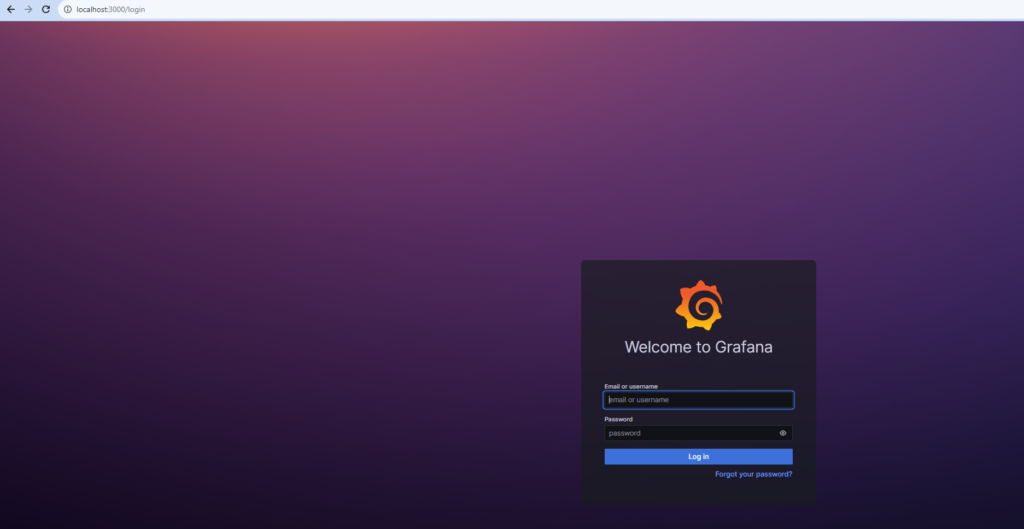
Dafult username/password are admin/admin
After 1st login you’ll be prompted to change the password.
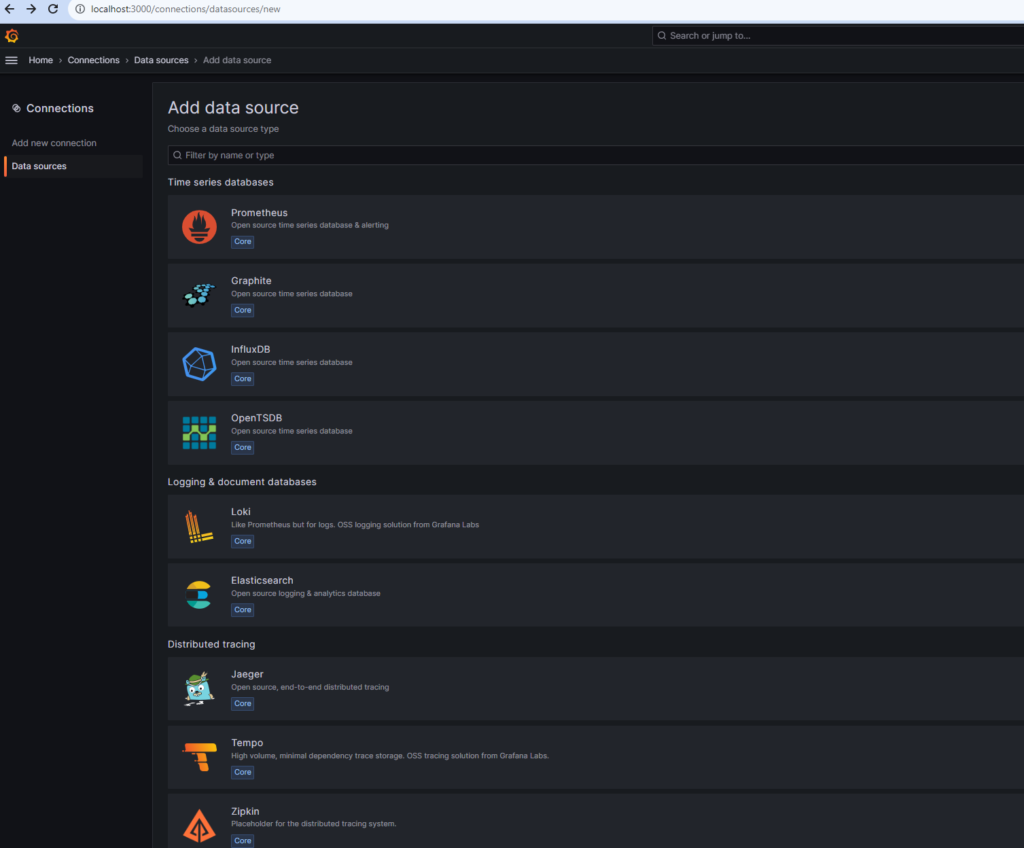
Create a datasource connection to our prometheus by choosing prometheus. Fill out the necessary fields like name, and connection URL(put your prometheus url here).
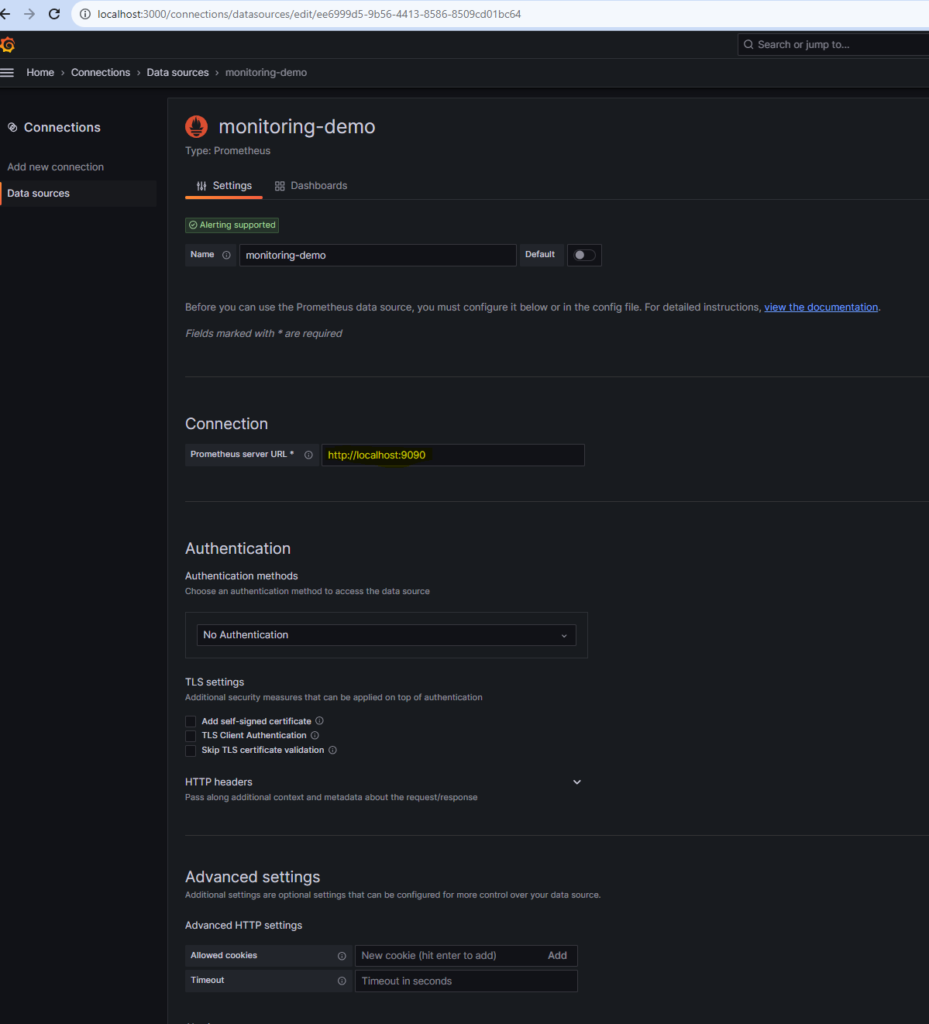
Test and save this connection. We can check the connection from the menu tab under connections – datasource
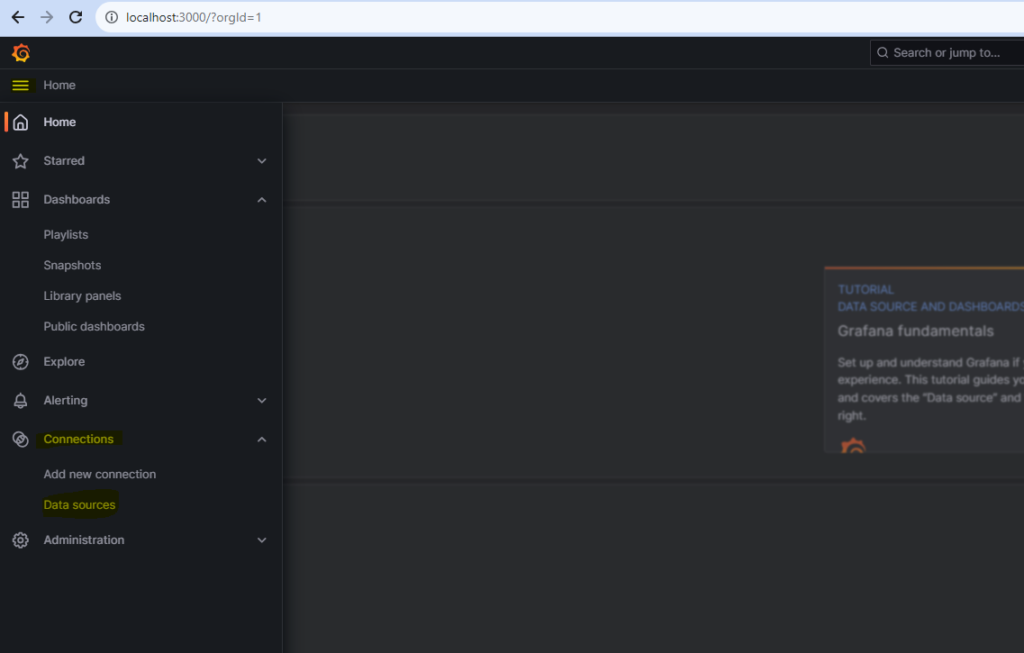
We can see our data source connection:

Now its time to create our dashboard to see the graphs with information. For that go to home page, and select DASHBOARDS

Select Add visualization.
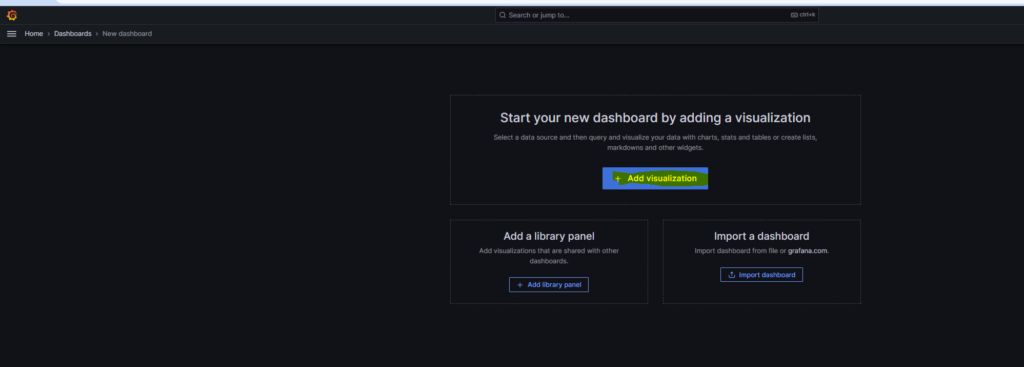
For datasource select the datasource that we created before which has connection to our prometheus.
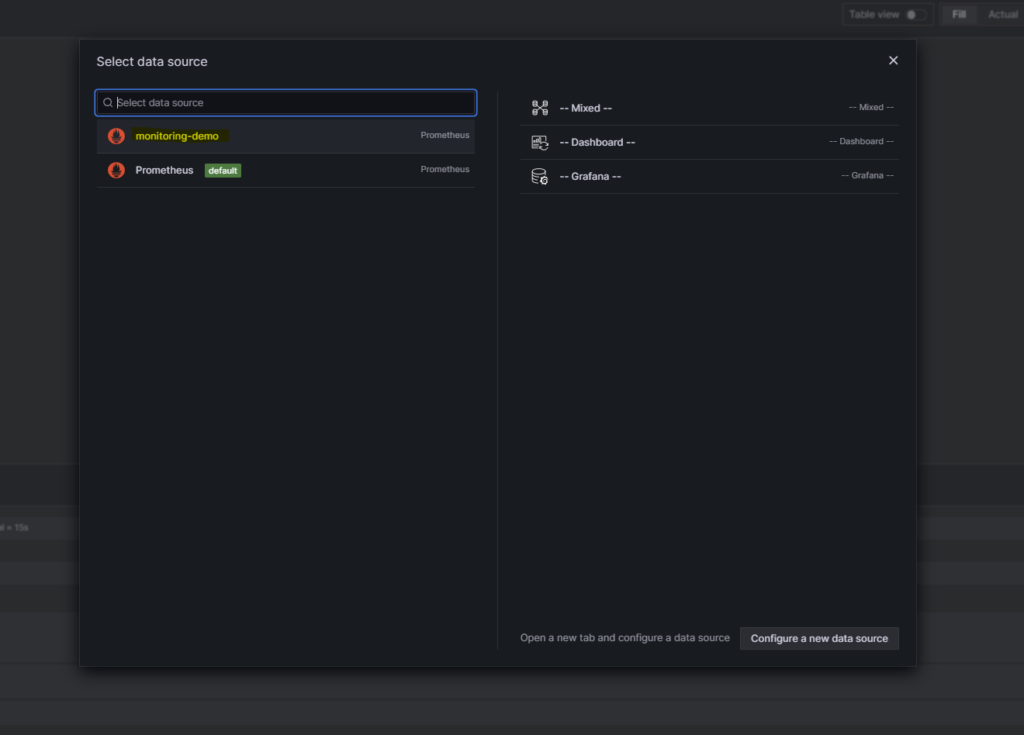
Now at the bottom we can select what metrics we want in our graph. I will select the logback events total and select label as level = info.
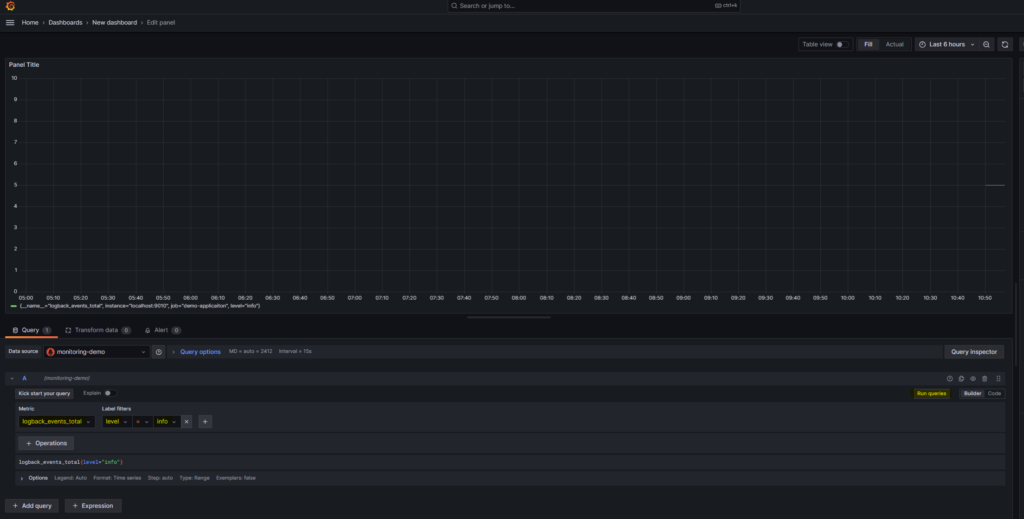
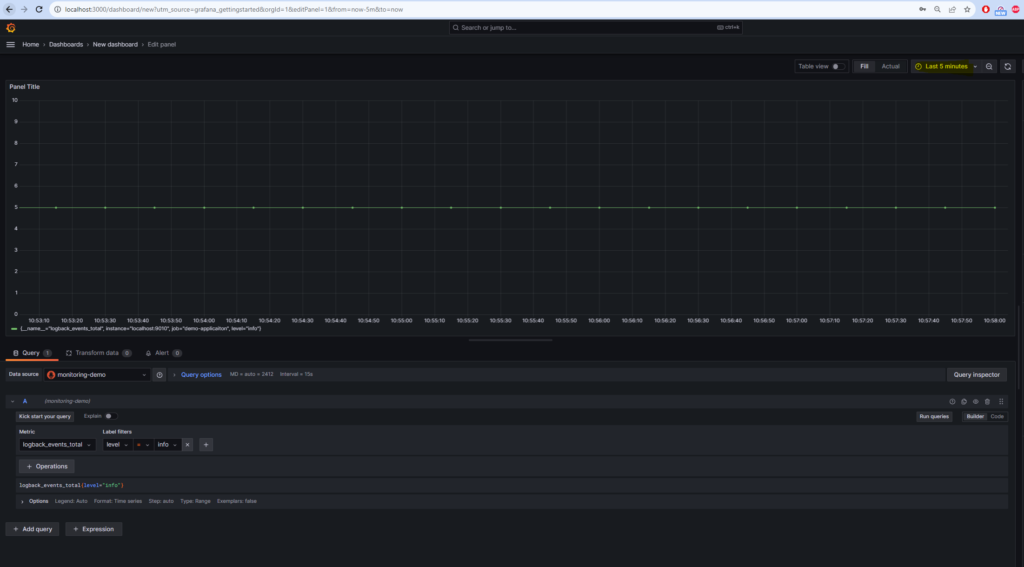
Lets change the dashboard to show data for last 5 mins from top.
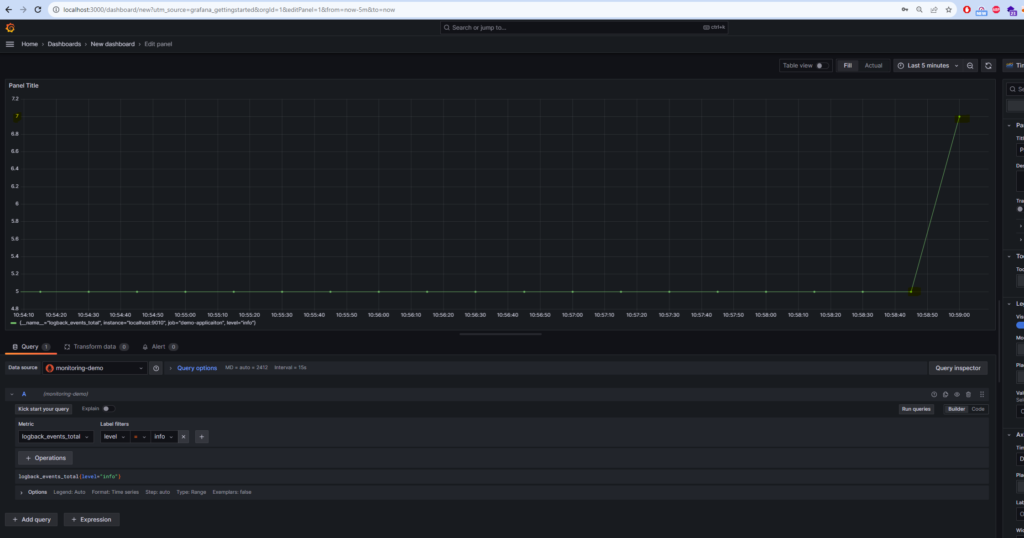
Now hit the monitoring endpoint so that our graph will show some spikes. If after hitting the api, the graph does not change, try refreshing the graph.
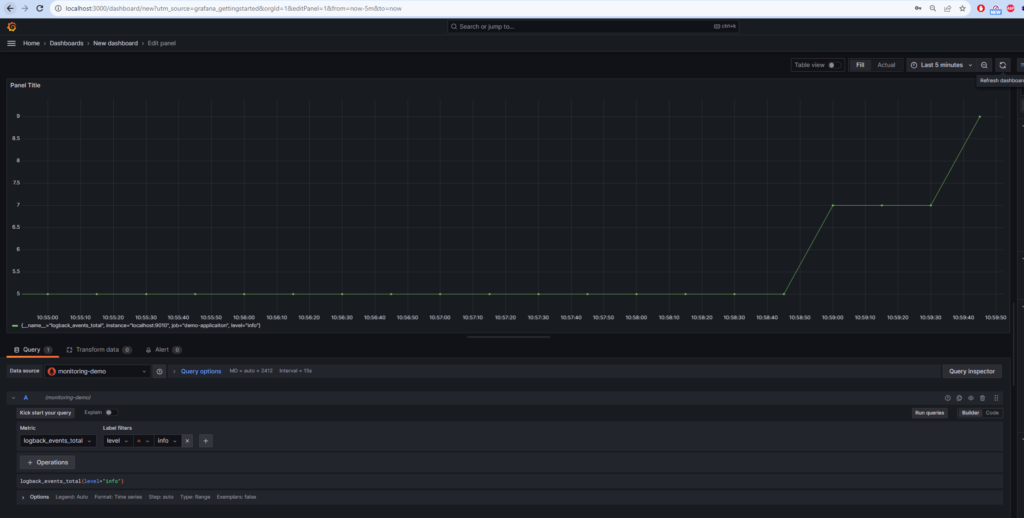
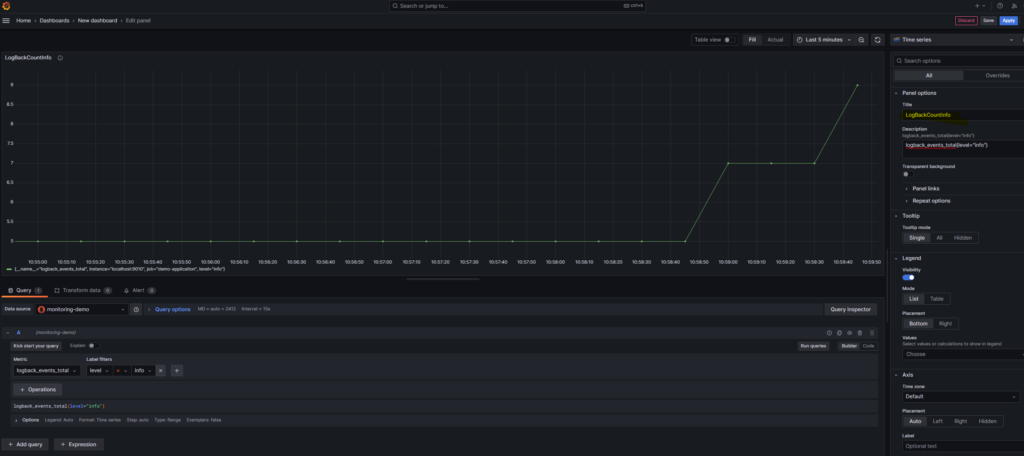
Provide some title and save this panel :
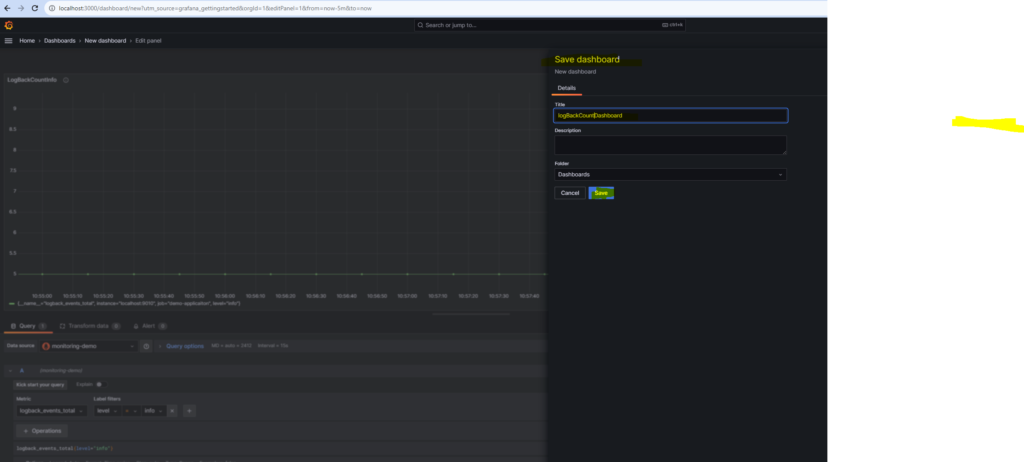
We can see the metrics under our dashboard section from menu.

Similarly we can add more panels in a Dashboard and create multiple dashboards.